


Information to guide our decisions
Definitions of key terms used in long-range planning work are on the Long-Range Planning Communications web page.
Clear, reliable data matter and are needed to inform the difficult decisions that lie ahead in Poudre School District. Here is an overview of important data that PSD is considering as it develops long range facilities plans.
What are you looking for? Click on the following links to see that information at the top of the page.
- Budget and School Funding
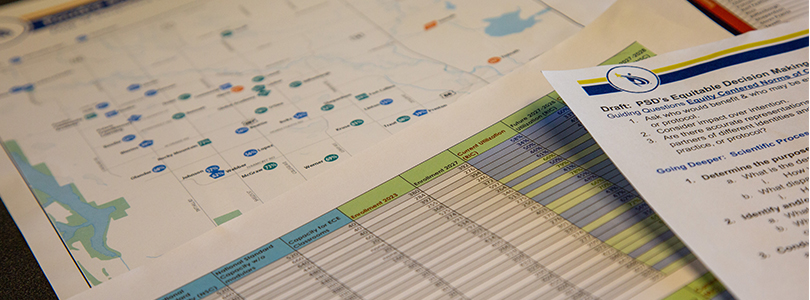
- Compiled Data - Facilities Planning Steering Committee
- Demographics and Population Trends
- Enrollment Trends and Projections
- Facilities Studies by McKinstry Engineering, LLC
- School Capacity and Utilization
- School Choice Patterns
![]()
Compiled Data
In an effort to make it easier to track all of the data that the Facilities Planning Steering Committee is reviewing in their work, the compiled worksheet linked here presents those data side-by-side.
![]()
Facilities Studies by McKinstry Engineering, LLC
In 2023, PSD hired McKinstry Engineering, LLC to conduct several studies on PSD facilities, including a solar feasibility study, an air conditioning feasibility study, a facilities condition assessment, which is an evaluation of the mechanical systems in PSD buildings, and a retro-commissioning study, which will evaluate opportunities for improved energy efficiency in PSD buildings. Review these studies on the Facilities Studies web page.>>
Facilities Condition Assessment reports by school were also generated and can be reviewed on the Facilities Studies web page. In addition to these reports, information on facility condition index, equity index, and utility cost are also posted on this page.
![]()
Demographics
PSD contracts with demographers on a regular basis to gather information about population trends and their potential impacts on our enrollment. The demographic reports that our demographers produce, generally rely heavily on US Census data as well as locally gathered data from the likes of the Colorado Department of Health, Larimer County and other sources.
2024 State Demographer Report, 2022 Cooperative Strategies Report and 2023 FLO Analytics Reports
- Feb. 20, 2024 | State Demographer Report | Feb. 20 State Demographer presentation to the Board of Education on YouTube.
- Cooperative Strategies Report: The most current demographic report produced by PSD’s independent third-party demographer, Cooperative Strategies, was created in 2022. In this report, Cooperative Strategies outlines five-year projections for all of PSD’s schools and provides multiple modeling scenarios for potential changes in enrollment based on available demographic data.
- FLO Analytics Reports: In 2023, PSD hired FLO Analytics to generate an updated demographic analysis on population trends that impact PSD. As part of its study of demographic and population trends impacting PSD, FLO Analytics also generated a report on student yield by housing type. This report considers the type of available housing within PSD’s boundaries and the number of students that are potentially yielded from this housing. This information contributes to a broader understanding of how factors beyond indicators like birth and fertility rates impact enrollment patterns.
Enrollment
Trends, Projections, School Choice Patterns, School Capacity and Class Sizes
Declining Enrollment
Colorado Department of Education data show that PSD has about 1,200 fewer students in our neighborhood and choice schools, which equates to roughly $12 million in school funding, over the past five years. We need to solve this financial problem immediately to ensure our district’s long-term health and vitality.
Going directly to the source is important. Here is a spreadsheet with Colorado Department of Education enrollment data that PSD's Finance Department presented April 9 to the Board of Education.
Trends
Each year, the total enrollment of each school district in Colorado is determined in October. This count is called "October Count." The number of enrolled students identified in the October Count is the number used to fund each Colorado school district. Official October Counts include charter school enrollments as well as enrollments for students who may or may not be fully funded (eg. those in special programs etc.).
PSD’s official October Count by grade level, including charter school enrollments and students who may not be fully funded for the last several years:
More: Home Sales and Building Permits in Larimer County 2007-2023
Projections
The Cooperative Strategies report referenced in the section above provides high-level projection information for PSD enrollment. As noted, these projections are based on Census data as well as other locally-sourced data.
In addition to those projections, PSD’s Information Technology team works closely with building administrators to develop multi-year enrollment projections. The most current five-year enrollment projections, which PSD schools used to budget for upcoming years, indicate a 9.26% enrollment decline over the next five years. See PSD's current five-year enrollment projections.>>
School Choice Patterns
In addition to regularly evaluating enrollment patterns in each of our schools, PSD also conducts an analysis of choice in and choice out patterns in our schools as well as between PSD charter schools, Charter School Institute charter schools and other districts and school options. This analysis uses data from various state databases as well as PSD’s enrollment data to evaluate student movement across schools.
- PSD's report, generated in 2022, on choice in and choice out patterns >>
- FLO Analytics' (a third party) report on choice in and choice out patterns in PSD >>
- 2023-24 PSD Student Movement Analysis
- 2023-24 Charter School Transfer Data
School Capacity
- The current capacities of PSD’s schools and the percent utilization of these spaces based on the 2022-23 October Count are available here.
- Map of PSD Schools - Current Capacities and Utilization
Calculating school capacity
PSD uses two primary calculations to determine the capacity of our school buildings: Room Index Capacity and National Standard Capacity.
- Room Index Capacity (RIC): This is a uniform calculation that is determined by counting the number of teaching spaces available in a building and multiplying that number by 25 students at the elementary level and 30 students at the secondary level. This calculation does not factor in gyms, art or music rooms, or computer labs.
- National Standard Capacity (NSC): This calculation is based on national norms for determining school building capacity. It begins with the Room Index Capacity calculation and then applies a percentage usage factor designed to account for the ways that schools actually operate (i.e. to ensure space is available for planning time, small group work, teaching spaces with unique programming needs, etc.).
- Usage factors by level:
- Elementary: 80%
- Middle School: 75%
- High School: 85%
- Middle-High School: 80%
- Usage factors by level:
When determining how much space is being used in a school building, PSD considers both of these capacity calculations. Additionally, space available in modular units is considered. In instances where Early Childhood (pre-kindergarten) or Integrated Services center-based programs are placed in schools, their capacities may be further modified to reflect these placements.
- How Early Childhood program placement and modular placement impact capacity >>
- More on calculating school capacity: FLO Analytics' (a third party) school capacity and utilization report in PSD >>
As a note, PSD’s Mountain Schools are geographically isolated schools. As such, their enrollments are typically much lower than other PSD schools.
Additionally, in the capacity document, transfer and capture rates are also included for each school in PSD. The capture rate is the percentage of students who reside in that school’s boundary area that attend the school. The transfer in rate is the percentage of students who opt to choice into the school. The transfer out rate is the percentage of students who are assigned to the school, but who opt to choice into another school.
In addition to considering choice in and choice out patterns as a whole, PSD also considers enrollment patterns related to program placement around the district. Programs refers to educational options like International Baccalaureate (IB) as well as Integrated Services programming. FLO Analytics also conducted a study of program placements district-wide - view their program analysis.>>
Class Sizes
Class sizes in PSD vary by school. District-wide, the average class size is 19 students. District-wide with the Mountain Schools, Integrated Services programs, and the Futures Lab removed, the average class size is 21 students. This document outlines the average class size at each PSD school (as of November 2023).>>
Budget and School Funding
PSD funds its schools, with the exception of alternative schools, using a student-based budgeting model (SBB). This model provides a per pupil allocation of funding to each school based on the school’s enrollment. Each school receives a base funding amount per pupil on top of which additional funding is added based on the percentage of students who qualify as at-risk, require additional levels of support, and gifted and talented students.
As enrollments in PSD schools decline, PSD must subsidize the school budget to ensure that comprehensive programming and services can be provided to students. This subsidization is referred to as the size factor.
The funding of each PSD school for the 2023-24 school year, including the percent subsidization that each receives as a size factor, is presented in this Summary of SBB and Other School Funding document. >>
This document also articulates the funding provided per pupil based on the base and included factors.
A summary of how funds are allocated across divisions in PSD is available in this general fund summary document. >>
In order to function optimally and efficiently from a financial standpoint, PSD elementary schools should have no less than 400 students enrolled and secondary schools should have no less than 700 students enrolled.
In addition to SBB, PSD funds its smallest and alternative schools using a model called zero-based budgeting. Zero-based budgeting provides funding to small schools at higher rates per pupil to ensure that the educational program offered at those schools can be sufficiently staffed and sufficient courses and services can be offered. The funding rates for schools on the zero-based budget model can also be found in the subsidization rate document linked above. Learn more about funding in PSD. >>